

SURVEY
The national elections of June 2023, as well as the European elections of 2024, recorded the highest abstention rates in the 20-year period 2004-2024. This fact is investigated, in terms of its qualitative characteristics, by the present research of the Heinrich Böll Foundation and Kappa Research leading polling agency, which was conducted between 3-17 July 2024. For the purposes of interpreting the data, an attempt was made to distinguish between those who voted, those who abstained for practical reasons (distance, work, health issues) and those who deliberately abstained. In this article, you can read some of the key findings, but also find the full survey in pdf format.

- There is a general feeling of frustration. The majority of respondents feel that parties and politics do not care about them, that the issues discussed in the public debate do not concern them, that the Greek economy favours the rich and that corruption in the political scene is pervasive and permeates all political parties.
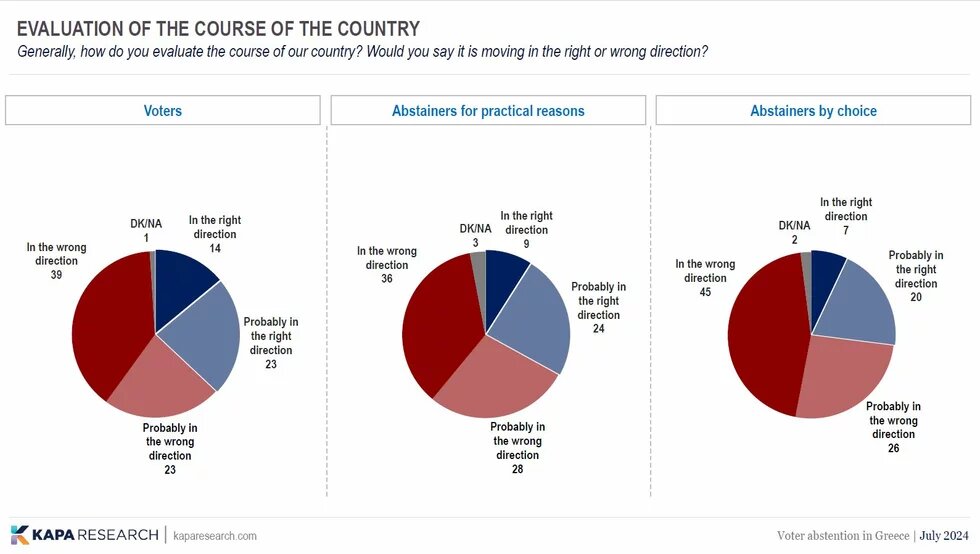
- There is widespread pessimism about the overall course of the country (over 60%).
- Confidence in institutions is generally shattered and political parties and trade unions in particular are perceived as unreliable by the majority of respondents. Especially those who abstain generally show even less trust compared to those who vote. The largest differences are observed in the judiciary (16 points difference), the government (14 points), the independent authorities (13 points), the Parliament and the banking system (12 points).

- The media scores very low in terms of trust and the majority of respondents believe that they try to manipulate the public into voting for certain parties based on their own interests. Social media is also considered unreliable as a source of information.
- The category of those who abstained from the elections is not a-political, i.e. politically neutral. They are "anti-political", i.e. they distrust or oppose traditional politics, starting with the traditional left-right scale, and have three characteristics: political apathy, political cynicism and political alienation.
- Non-affiliation with an ideological area leads to abstention. In particular, 10% of people who voted but 27% of those who abstained by choice (rather than for practical reasons) do not place themselves anywhere on the Left-Right scale. In contrast, those who identify themselves within a political space, and especially on the left and around the centre, are more likely to vote than to abstain.

- Abstainers also believe, to a significantly greater extent, than the ones who have voted that the political positions of the parties hardly differ at all (35% vs. 19%).

- The abstention is not random. Of those who abstained in the 2023 national election, 15% never voted and only 61% say they always or most of the time vote (compared to 99% of those who voted).

- Those who voted and those who abstained have a generally similar view of the country and its problems, with the most crucial among them being exploding living costs. The difference is that abstainers see crime (33% vs. 24% of those who voted) and the political system (26% vs. 13% of those who voted) as problems to a significantly greater extent than those who voted. Similarly, they show significantly less interest in issues such as demography (17% vs. 33%), the environment (5% vs. 13%) and Europe (29% vs. 39%).

- Abstainers compared to voters show generally less interest in both politics and civic participation. In particular, 45% of abstainers say they have little or no interest in politics compared to 12% of voters, while abstainers are about 10% less involved in collective activities not necessarily related to politics than voters.


- There is a small but distinct gender dimension to abstention from voting. In particular, women abstainers are 10% more than men (55% and 45%) and correspondingly men who vote are about 10% more than women (54% and 46%).
- Age also plays a role, as it seems that younger generations are more familiar with abstention than older generations. In the 17-34 age group the percentage of those who vote is 19% and those who abstain is 27%. By contrast, in the 55+ age group the percentage of those who vote is 48% and those who abstain 35%.

- Voters and abstainers have very similar educational and social characteristics (i.e. level of education and social class) and quite similar economic situations (those who abstain are slightly worse than those who vote).
