


ARTICLE
In one of the first scientific articles to use the data from the 2021 census, Professor of Demography Byron Kotzamanis describes the evolution of the population in Greece since the first post-war period, based on births/deaths and spatial changes. He also analyses the scenarios for how the population will look in 2050, sounds the alarm about irreversible developments and points out the issues on which the state should focus in order to mitigate the economic and social consequences.

Translator’s note: In the Greek local government system the largest division is the region, followed by the regional unit, the municipality, the municipal unit and the municipal-local community.
Ι. Introduction
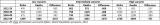
The Greece of today is very different from that of the first post-war period (Table 1). Our population has increased by three million since 1951, we live much longer, we are ‘older’, we have fewer children and fewer marriages, we have many more deaths, our natural balances are negative, we divorce more easily, and we live mainly in urban centres; at the same time, our population, from previously being relatively ‘ethnically homogeneous’, now includes about 900,000 foreigners living permanently in our country. The implications of both past and expected changes are manifold, and political parties and social, professional and scientific bodies, as well as public opinion, are showing an increasing interest in both current developments and the future demographic course of Greece. We are thus beginning, albeit belatedly, to gradually realise that demography is a factor that we can no longer afford to underestimate, and the demographic issue is emerging as one of the issues that must be addressed immediately, with the aim of halting existing trends and mitigating any negative effects (especially those arising from demographic ageing).
|
|
II. The population of Greece, yesterday and today
The changes in the basic demographic components after 1950, in combination with the post-war model of economic and social development of Greece, has had a significant impact on the size and age structures of the population and its spacial distribution, resulting in the following dynamics.
1. The over-concentration of the population in an extremely limited part of the total surface area and the abandonment of the countryside, as half of Greece’s population is concentrated in 2.9% of its total surface area (compared to 25.6% in the early 1950s) and two-thirds in 6.4% of the surface area (compared to 50% in 1951), while 76 out of 100 inhabitants now live in urban centres (compared to only 36 in 1951). It should also be noted that the migratory flows to urban centres that marked the second half of the twentieth century have been halted in the last 15 years, while at the same time a reversal trend is emerging. However, even if this trend is reinforced by some measures (e.g. helping young people to settle and operate in the countryside), it will not radically change the population map of Greece in the coming decades (Maps 1 and 2).
 |
 |
2. The mass migration to other countries in the first post-war decades, the reversal of the flows thereafter (repatriation and entry of economic migrants to Greece until the late 2000s) and the re-emergence of a wave of flight after 2010 (both young Greeks and young foreign permanent residents leaving the country). The recent exodus has contributed decisively to the creation of a spatially differentiated migration balance that is negative, despite the settlement in the country over the last seven years of a number of foreigners who entered the country irregularly (see ‘refugee crisis’). If these balances continue to be negative, added to the expected negative natural balances, they will lead to an even greater decrease in the population of Greece and, obviously, to an acceleration of demographic ageing.
3. The very low birth rate and fertility, namely a limited and declining number of births, low annual fertility rates (<1.5 children per woman) over the last 35 years and a continuous decline in the number of children born by the post-1960 generations (Table 2). The reversal of declining fertility trends and its future recovery cannot be achieved if i) the proportion of women without children stabilises around 25% in the younger generations, and ii) the probability of those who have a first child to have a second (and also those who have had a second to bear a third) does not increase. But this requires the creation of a conducive environment for having the desired number of children, and, in particular, the removal of incompatibilities between work and family life (as well as of the still persistent gender discrimination in many areas) and the reduction of the additional costs (direct and indirect) resulting from the arrival of a child. This would give private sector workers who have children (or are expecting a child) any ‘advantages’ that their public and extended public sector counterparts have, making it possible for them to obtain housing without a shocking burden on the family budget through a new, extensive social housing programme, rapidly reducing the still very high unemployment rates among young people and increasing their disposable incomes, and reducing the precariousness of their employment relationships. At the same time, however, it also requires an effective and expanded welfare state that will, among other things, provide adequate support and partially remove the widespread insecurity of the younger generations, which is one of the obstacles to them forming a family (of any kind) and having children (any number of them).
 |
4. The problematic evolution of life expectancy at birth. Although the increase of this indicator was rapid in Greece in the first post-war decades, the last 25 years have seen a slowdown in its positive rates. The slower growth in life-years’ earnings in Greece compared to other EU Member States (before the EU enlargement in 2004 and 2007) is mainly due to the less effective treatment of the two major groups of causes of death (circulatory diseases and cancers) affecting the mature and older age groups. This ineffective response is an indication of the weaknesses of the Greek health system. Recent EU and OECD reports detail these weaknesses: the low percentage of expenditure from public sources; the strong spatial imbalance in the distribution of equipment and human resources in the enlarged health sector; the significant role of private expenditure and the high informal payments (which raise serious concerns about equity of access to health care services); the limited resources for preventive care (less than 1.5% of health expenditure); the very high level (second highest in the EU) of unmet care needs; the non-systematic pre-symptomatic cancer screening; the high levels of in-hospital infections; the insufficient development of an integrated primary care system; and the very low expenditure (among the lowest in the EU) on out-of-hospital care and long-term and preventive care.
5. The negative natural balances (births/deaths) after 2010 (Graph 1), which, without immigration, would have already been negative in the late 1990s. These balances are clearly spatially differentiated, as in the period between the last two censuses, with 315,000 more deaths than births at the national level, and these were positive in only one-sixth of the municipalities. And in the five-year period (2015–2019) preceding the Covid-19 pandemic, if at the national level there were 135 deaths per 100 births, in 37% of municipalities, deaths were more than double the number of births, and in 8% of them, more than quadruple (Map 3), while in the municipal units the corresponding percentages were 55% and 37% (Map 4). Very few municipal units had relatively even balances of births and deaths and very few had positive balances, with the majority of the latter being located in the wider periphery of the country’s two largest central municipalities, the Cyclades and the Dodecanese, and the northern axis of Crete.
 |
 |
 |
6. The decline of the total population, which had already begun in the early 2010s and is expected to continue in the coming decades. This decrease does not concern all the territorial units of Greece, as significant deviations from the average (decrease of 3.5%) were recorded (2011–2021). In particular, the first analysis of the provisional results of the 2021 census shows that 61 regional units had a decrease and 13 an increase, while in the municipalities (Map 5) an increase is recorded in only one out of four (81 out of 325) and very small fluctuations (from -2.0% to +2.0%) in one out of five (61 out of 325). Most of those who increased their population are located in the Dodecanese region and around the two metropolitan centres of Athens and Thessaloniki (and to a lesser extent in Crete and the Cyclades), while the majority of those who had rates of decrease well above the national average (more than -5%) are concentrated in mainland Greece, especially in Northern Greece and Thessaly.
 |
7. The high, but strongly spatially diverse, demographic ageing and ‘ageing within ageing’, namely the high proportion of people aged 65 and over (22.5%) and 85 and over (3.6%) in the total population, and the significant spatial variations underlying the national averages (Map 6). In particular, 11 regional units (8% of the country's total population and 22% of its surface area) are ‘ahead of the pack’, having more than one elderly person out of four inhabitants, while in two of them the ratio is almost 1:3, with the consequence that the proportion of people aged 65 and over in these regional units is higher today than expected in 2050 (30–33%) at the national level! Moreover, an examination of the specific proportion of 85+ years to 65+ years (Map 7) highlights another dimension, namely that of ‘ageing within ageing’. Thus, if today at the national level there are slightly less than 16 people who are 85+ per 100 people who are 65 and over, in 15 regional units with a total population of one million in 2020 (9% in 25.5% of the surface area), there are more than 18, and in four of them (Laconia, Arcadia, Fokida and Evritania) more than 20 people aged 85 and over. These four regional units have therefore already exceeded, 30 years earlier, the national average expected in 2050, while the other 11 are expected to do so very soon. We are thus heading towards an explosive combination of ‘ageing’ and ‘over-ageing’ in more than one out of four regional units in Greece, with the outcome that soon (well before 2050) we will have a group of regional units with one-third of their population aged 65 and over, while at the same time a quarter of them will be ‘over-aged’.
If this rapid ageing of a large part of mainland Greece is not halted, it will undermine any efforts towards territorial, social and economic cohesion of the country. It is therefore necessary to stop the wave of young people leaving the country and to attract and settle a young population in these areas if we do not want to find ourselves very soon (and not in 2050) in an irreversible situation, with a large part of Greece constantly losing population, with more and more elderly and ‘over-aged’ people.
 |
 |
8. The rapid changes in the structure and composition of households of people aged 65 and over. The changes in the course of the key demographic components of the last decades have already begun to affect, among other things, the structure and composition of households of the elderly, and will continue to do so in the future. Thus, the ‘close’ family environment — particularly in urban centres — of people aged 65 and over born after 1980 will consist of fewer and fewer people than those born in previous decades, while an increasingly large proportion of them will be alone in the last years of their lives. The stakes, given that today the family largely replaces the welfare state, are obvious, even if we assume that existing family ties will not fade in the coming decades.
Factors such as mortality, fertility, the formation and dissolution of partnerships, and internal and external migration in recent decades have all shaped the current demographic landscape in Greece. At the national level, the debate focuses mainly on population ageing and low birth rates/fertility, and their direct and indirect effects. However, the differentiated — often at the same time — course of the above-mentioned factors has resulted not only in a strongly unequal distribution of the population in the area, but also in the strongly differentiated age structures of the population today at lower than national levels (see ageing). The aforementioned has not been of real concern to us, although the recent (provisional) data from the 2021 census have captured some of the effects of the game of demographic components of recent decades at these levels. However, the picture given by this census is often perceived as the result of the developments of the last decade, while it has not yet been understood that due to the significant inertia of demographic structures, the reversal of any negative trends requires policy measures that i) if taken today will pay off in the medium to long term and ii) recognise the fact that the longer the delay in their adoption, the more difficult — if not impossible — the reversal will be. However, any measures require an understanding of the parameters that have played a decisive role in shaping trends at the national level, as well as those that have caused the current strong spatial differentiations, and obviously an awareness of the important role of the ‘population’ parameter in the social, economic and territorial cohesion of Greece.
III. The population of Greece towards 2050
How will the population of Greece evolve in the coming decades? A first answer to this question can be given on the basis of the recent (November 2022) projections of the United Nations.[i] The three main scenarios of the projections of this international organisation for Greece differ only in terms of the future course of fertility, as the assumptions on mortality and migration are common (increase in life expectancy at birth by about 5.5 years and at 65 by almost 4 years, and a very small positive migration balance of 140,000 people). On the basis of these assumptions, the expected population of Greece in 2050 will be lower than in 2022 in all three scenarios (ranging from 9.8 to 8.5 million). As the migration balance (+5,000 per year) and the mortality trend are common, the differential population decline is exclusively due to negative natural balances, as the continued and unstoppable increase in the 65+ population leads to a high number of deaths that will not be compensated by births, even in the most favourable (‘high’) fertility scenario.
These projections show that:
i) Natural balances will continue to be negative until 2050 (although clearly differentiated per scenario), contributing decisively to population decline (Table 2). To avoid the decline, a total migration balance much higher than 140,000 people, projected by the UN in all scenarios, would be required for the period 2022–2049, and, in particular, migration balances greater than or equal to: 1,520 million in the ‘intermediate’ scenario; 870,000 in the ‘high’ (and very unlikely) scenario; and 2,150 million in the very unlikely ‘low’ scenario.
 |
ii) The population in Greece, currently estimated at 10.5 million, will continue to decline until 2050, at different rates per scenario (9.2 in the ‘intermediate’ most likely scenario, 8.5 in the ‘low’ scenario and 9.8 in the ‘high’ scenario).
iii) The evolution of the size of the three major age groups differs significantly per scenario (Graph 2):
- The only age group that will increase is that of 65 and over. Its size does not change in the three scenarios (it will reach 3.16 million in 2050 compared to 2.37 in 2022, an increase of almost 800,000), unlike its specific proportion (its share of the total population), which varies from scenario to scenario. In any case, ageing is irreversible.
- The population of young people (0–19 years old) is expected to decrease from a tiny fraction to 1 million.
- The population aged 20–64 years will also decrease by 1.36 to 1.65 million (in the ‘low’ and ‘high’ scenarios, respectively), and by 1.5 million in the ‘intermediate’ scenario, affecting the labour force and its various components.
Although the reduction of the working-age population cannot be avoided, the reduction of the employed population can, under two conditions:
a) If the positive net migration balance for the period 2022–2049, from +140,000 projected by the UN in all scenarios, is more than tripled (from 5,000 to 17,000 per year, i.e. 476,000 in total for 2022–2049, compared to 140,000 projected by the UN).[ii] This change will add around 300,000 people to the working-age population and, depending on their employment rate, between 230,000 and 240,000 to the 2050 workforce.[iii]
b) Increasing the participation rate of people aged 20–64, which is currently one of the lowest in the EU (66%), as we have one of the lowest labour force participation rates for these age groups and one of the highest unemployment rates. This current disadvantage could in future turn into an advantage if the participation rates of 20–64-year-olds in the economically active population, as well as those in unemployment, progressively (with a view to 2050) reach the current levels in a number of Northern European countries, where the employed make up 82% of the working-age population. In this case, the employed in 2050 would decrease by “only” 300,000 (from 4.0 million in 2022 to 3.7 million in 2050), while if the two above-mentioned percentages remain at current levels, they would decrease by 700,000. If the above-mentioned increase from 66% to 82% is achieved, the decrease in the employed would be less than 8%, even though the working-age population aged 20–64 is expected to decrease by 25% in the scenario presented here. This small reduction in employment through a single domain[iv] of a single dimension of the economic model therefore highlights the crucial role of the economic component.
 |
Of course, since the increase in the elderly population is irreversible by 2050, any increase in the migration balance (such as a tripling of it) will have no effect on the expected number of elderly people. Thus, even if the number of employed persons does not decrease, there will be 1.25–1.30 employed persons per 1 person aged 65 and over in 2050, compared to 1.7 today.[v] The expected increase in the number of people aged 65 and over (as well as the increase in their specific proportion, as they are the only age group that increases when the total population decreases) leads the majority of economists to focus on the negative consequences of this increase, emphasising the rapid growth in expenditure, particularly on pensions and care for the elderly. These arguments are strong, and the simulation models used confirm them. After all, it is considered that, on the basis of current trends, the incomes of the economically active are at risk, the distribution of transfers between the various categories is becoming particularly difficult and there are even intergenerational tensions in sight that could lead to a ‘war of the ages’, which could result in our modern societies entering a period of social and economic crisis.
At a first level of analysis, if we adopt these arguments, we are faced with a relatively simple cause-and-effect relationship, where expenditure on the elderly is the dependent variable and demographic ageing is the determinant of its soaring costs. But the relationships are more complex than usually presented. It should be remembered that there are three components in the balance of systems: demographic, economic and socio-political (institutional). To highlight the first of these as the only decisive factor (as is usually the case) is problematic. We must recall at this point that, as far as the economic component is concerned:
- The increase in the number of older people will inevitably be followed by an increase in demand for new products and services. This demand, as well as the development of so-called ‘noble’ activities (such as education, care and treatment, assistance to the less favoured, etc.), which are currently largely regarded as ‘unproductive’ (and therefore subject to the consequences of austerity), could boost the economy in the future. The challenges associated with ageing can be transformed into opportunities to create new sectors, in order to create a ‘silver economy’ that encompasses a wide range of economic activities: from products and services to measures to promote mobility and assisted independent living.
- The above-mentioned proposed increase in the ‘employed/working age population’ ratio is not the only dimension of intervention — labour productivity, the value added of goods and services, the division of the employed into full-time and part-time, their wages, the ratio of declared and undeclared work, and the distribution and ‘capture’ of the wealth produced are only some of the key parameters that determine the contribution of the 20–64 age group, and not exclusively its number. Intervention in these areas is essential, and the expected demographic developments simply make changes in a number of areas more urgent, thus implicitly pointing the way to a new economic policy and a new development model. Finally, the question that can reasonably be asked in Greece is whether the aforementioned restructuring and reorganisation can be carried out without — among other things — changes in the ways of producing and distributing collective wealth, changes that are required because of — among other things — the demographic developments.
Based on the above, and given that the projections are generalisation exercises with relatively small margins of uncertainty when referring to the short and medium term, we can now define the fields of possibility and take action. Those responsible for planning and decision-making at the national and regional level cannot, therefore, remain spectators. They must, on the one hand, take for granted certain demographic trends that will become irreversible in the coming decades, assess their impact and take them into account, and, on the other hand, take appropriate measures now to reverse these trends in the medium to long term. Therefore, pre-activity and pro-activity should replace any passivity and waiting behaviour.
[i] United Nations, Department of Economic and Social Affairs, World Population prospects 2022.
[ii] It should be noted that the (positive) migration balance for the years 1991–2010 reached 800,000 (40,000 per year on average).
[iii] A positive migration balance requires a halt to the outflow of young people of productive and reproductive age, the gradual return of part of them and, obviously, the entry and integration of new foreigners. It will result in a smaller reduction in both the total population and the working-age population, slowing down ageing (i.e. the increase in the proportion of older people in the total population) and filling any gaps in the labour market. However, immigration will not remedy the very low fertility rate and therefore cannot prevent population decline and ageing in the long term: it is impossible to stabilise the population in a country such as Greece, where the average number of children per woman is consistently well below the number needed for reproduction (2:1). It would require, on a permanent basis, an immigration balance much higher than the one we had in the years 1991–2010 (40,000 per year on average).
[iv] We have only referred to employment and unemployment for the 20–64 age group. We have not addressed at all the labour force participation of the 65 and over group, a large part of which is currently ‘excluded’ from the labour market. A classic example is those who have already retired (many of them at a relatively young age), as the current institutional framework makes it almost impossible for them to be employed, pushing them into undeclared work.
[v] If we accept that all 65+ are, and will continue to be, inactive. Recall that today, according to the Labour Force Survey, we currently have 120,000 employed in the 65+ category.